Mapping and Geospatial Data
Geospatial data and mapping technologies are crucial for effective data-drive disaster management. By leveraging tools like geographic information systems (GIS), crisis mapping, and open-source collaborative platforms, humanitarians can visualize risks, optimize resource allocation, streamline responses, and build community resilience. The power of location intelligence and spatial analysis lies at the heart of comprehensive disaster preparedness and risk management strategies, enabling to make informed decisions and mitigate the impact of disasters.
Crisis mapping and its role in disaster management
Crisis mapping is a dynamic method that involves the real-time data collection, visualization, and analysis to assess, document, and communicate the impact of disasters and conflicts. By leveraging advancements in mobile technology, internet connectivity, social networking, and geographical information systems (GIS), crisis mapping enhances the efficiency and effectiveness of disaster management efforts.
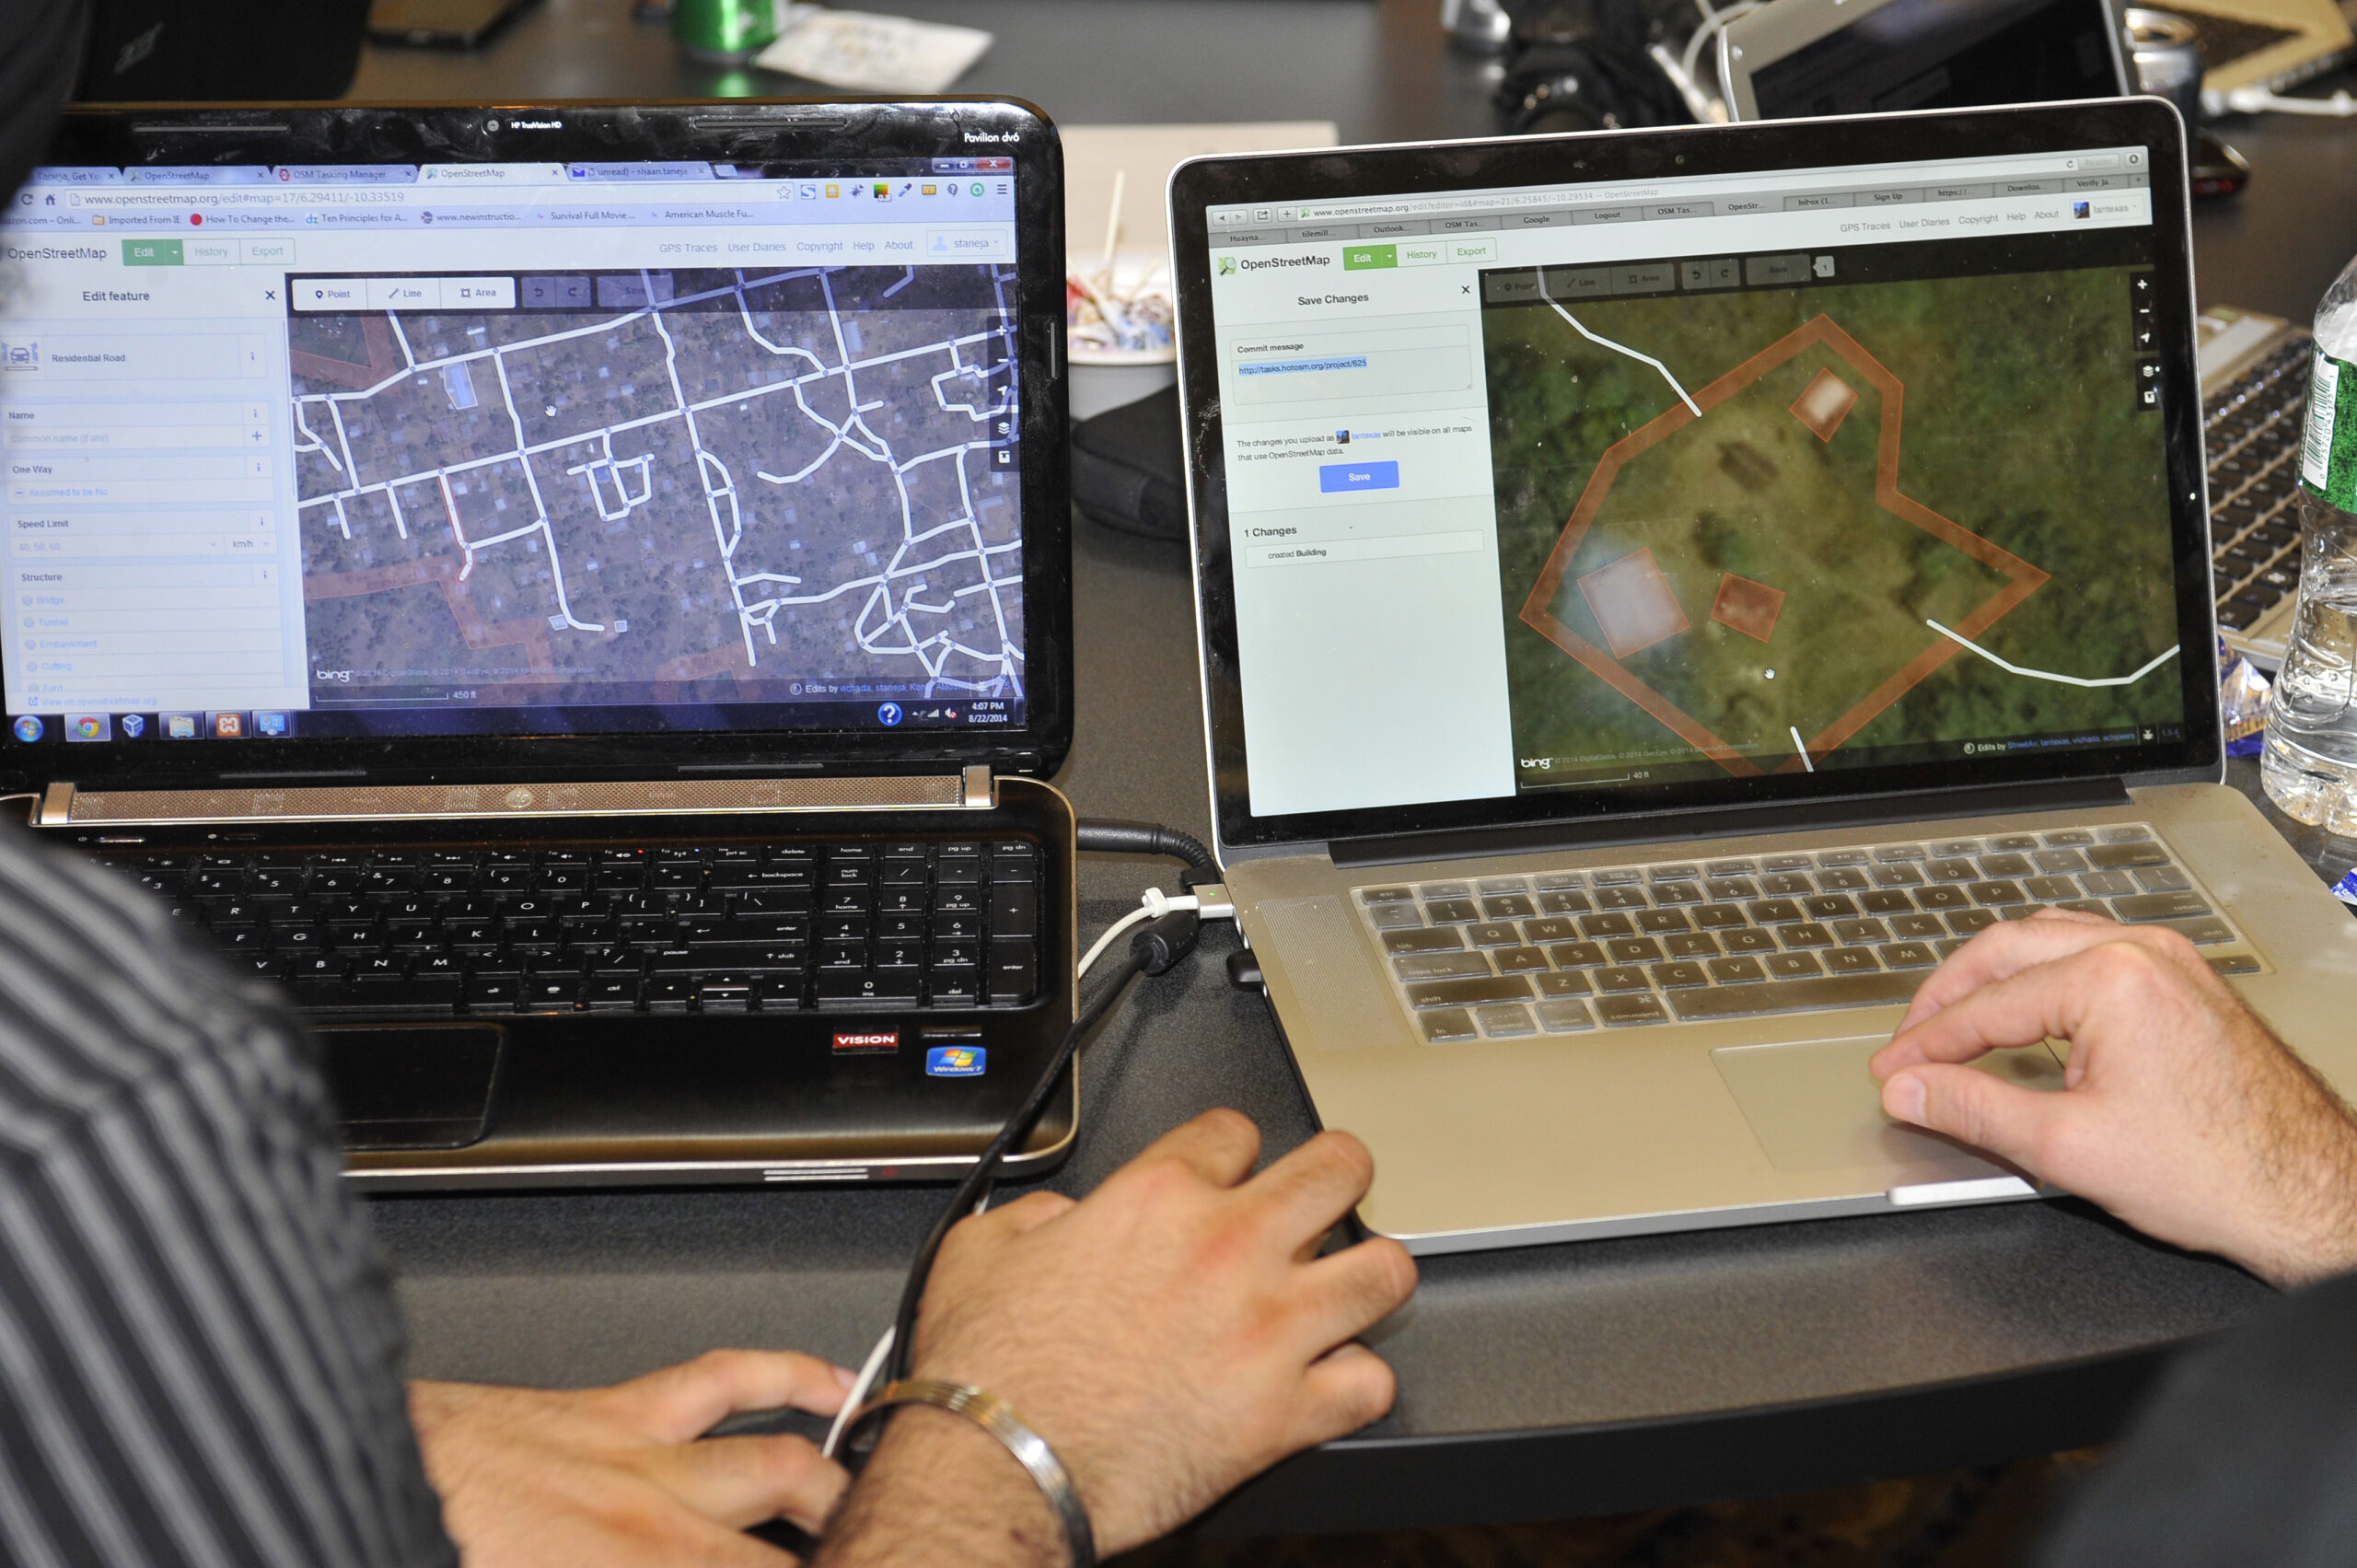
Crisis mapping enables global collaboration through free and open-source software platforms such as Ushahidi, Sahana, and OpenStreetMap. By utilizing these platforms, individuals from all over the world can contribute to the creation of detailed, interactive maps that provide up-to-date information on crisis situations. This collaborative effort empowers emergency responders and practitioners to quickly gather, retrieve, and visualize real-time information, enabling them to better prepare for, mitigate, and respond to emergencies.
Crisis mapping gained prominence in the aftermath of the 2010 Haiti earthquake thanks to tools like Ushahidi (Swahili for "witness") and OpenStreetMap. Ushahidi launched a crisis map that crowdsourced reports from various sources, including social media, news outlets, and affected communities. Meanwhile, OpenStreetMap mobilized global volunteers to create a map of Haitian infrastructure using satellite imagery and GPS data to help identifying damaged areas and infrastructure.
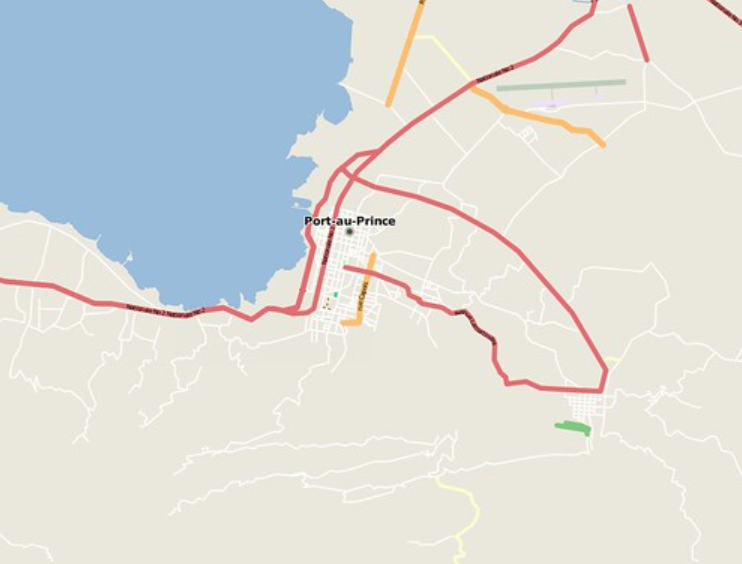
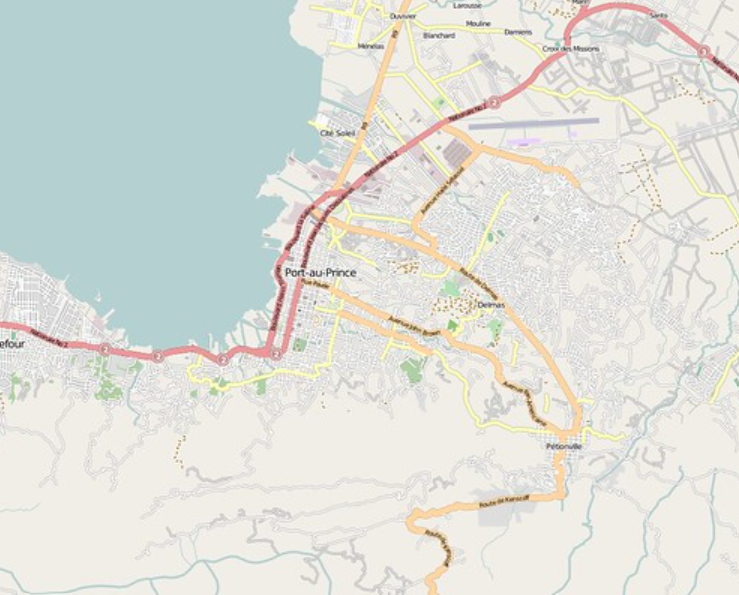
A comparison of Port-au-Prince maps before and after the open mapping initiative following the 2010 earthquake, highlighting the significant increase in available data for more precise humanitarian operations in the affected area.
Crowdsourcing
Crowdsourcing is a critical component of effective crisis mapping. By relying on the collective intelligence and capabilities of the public, including affected communities and volunteers worldwide, crowdsourcing helps provide responders with contextualized, real-time information in disaster-affected areas where conditions and needs are constantly evolving.
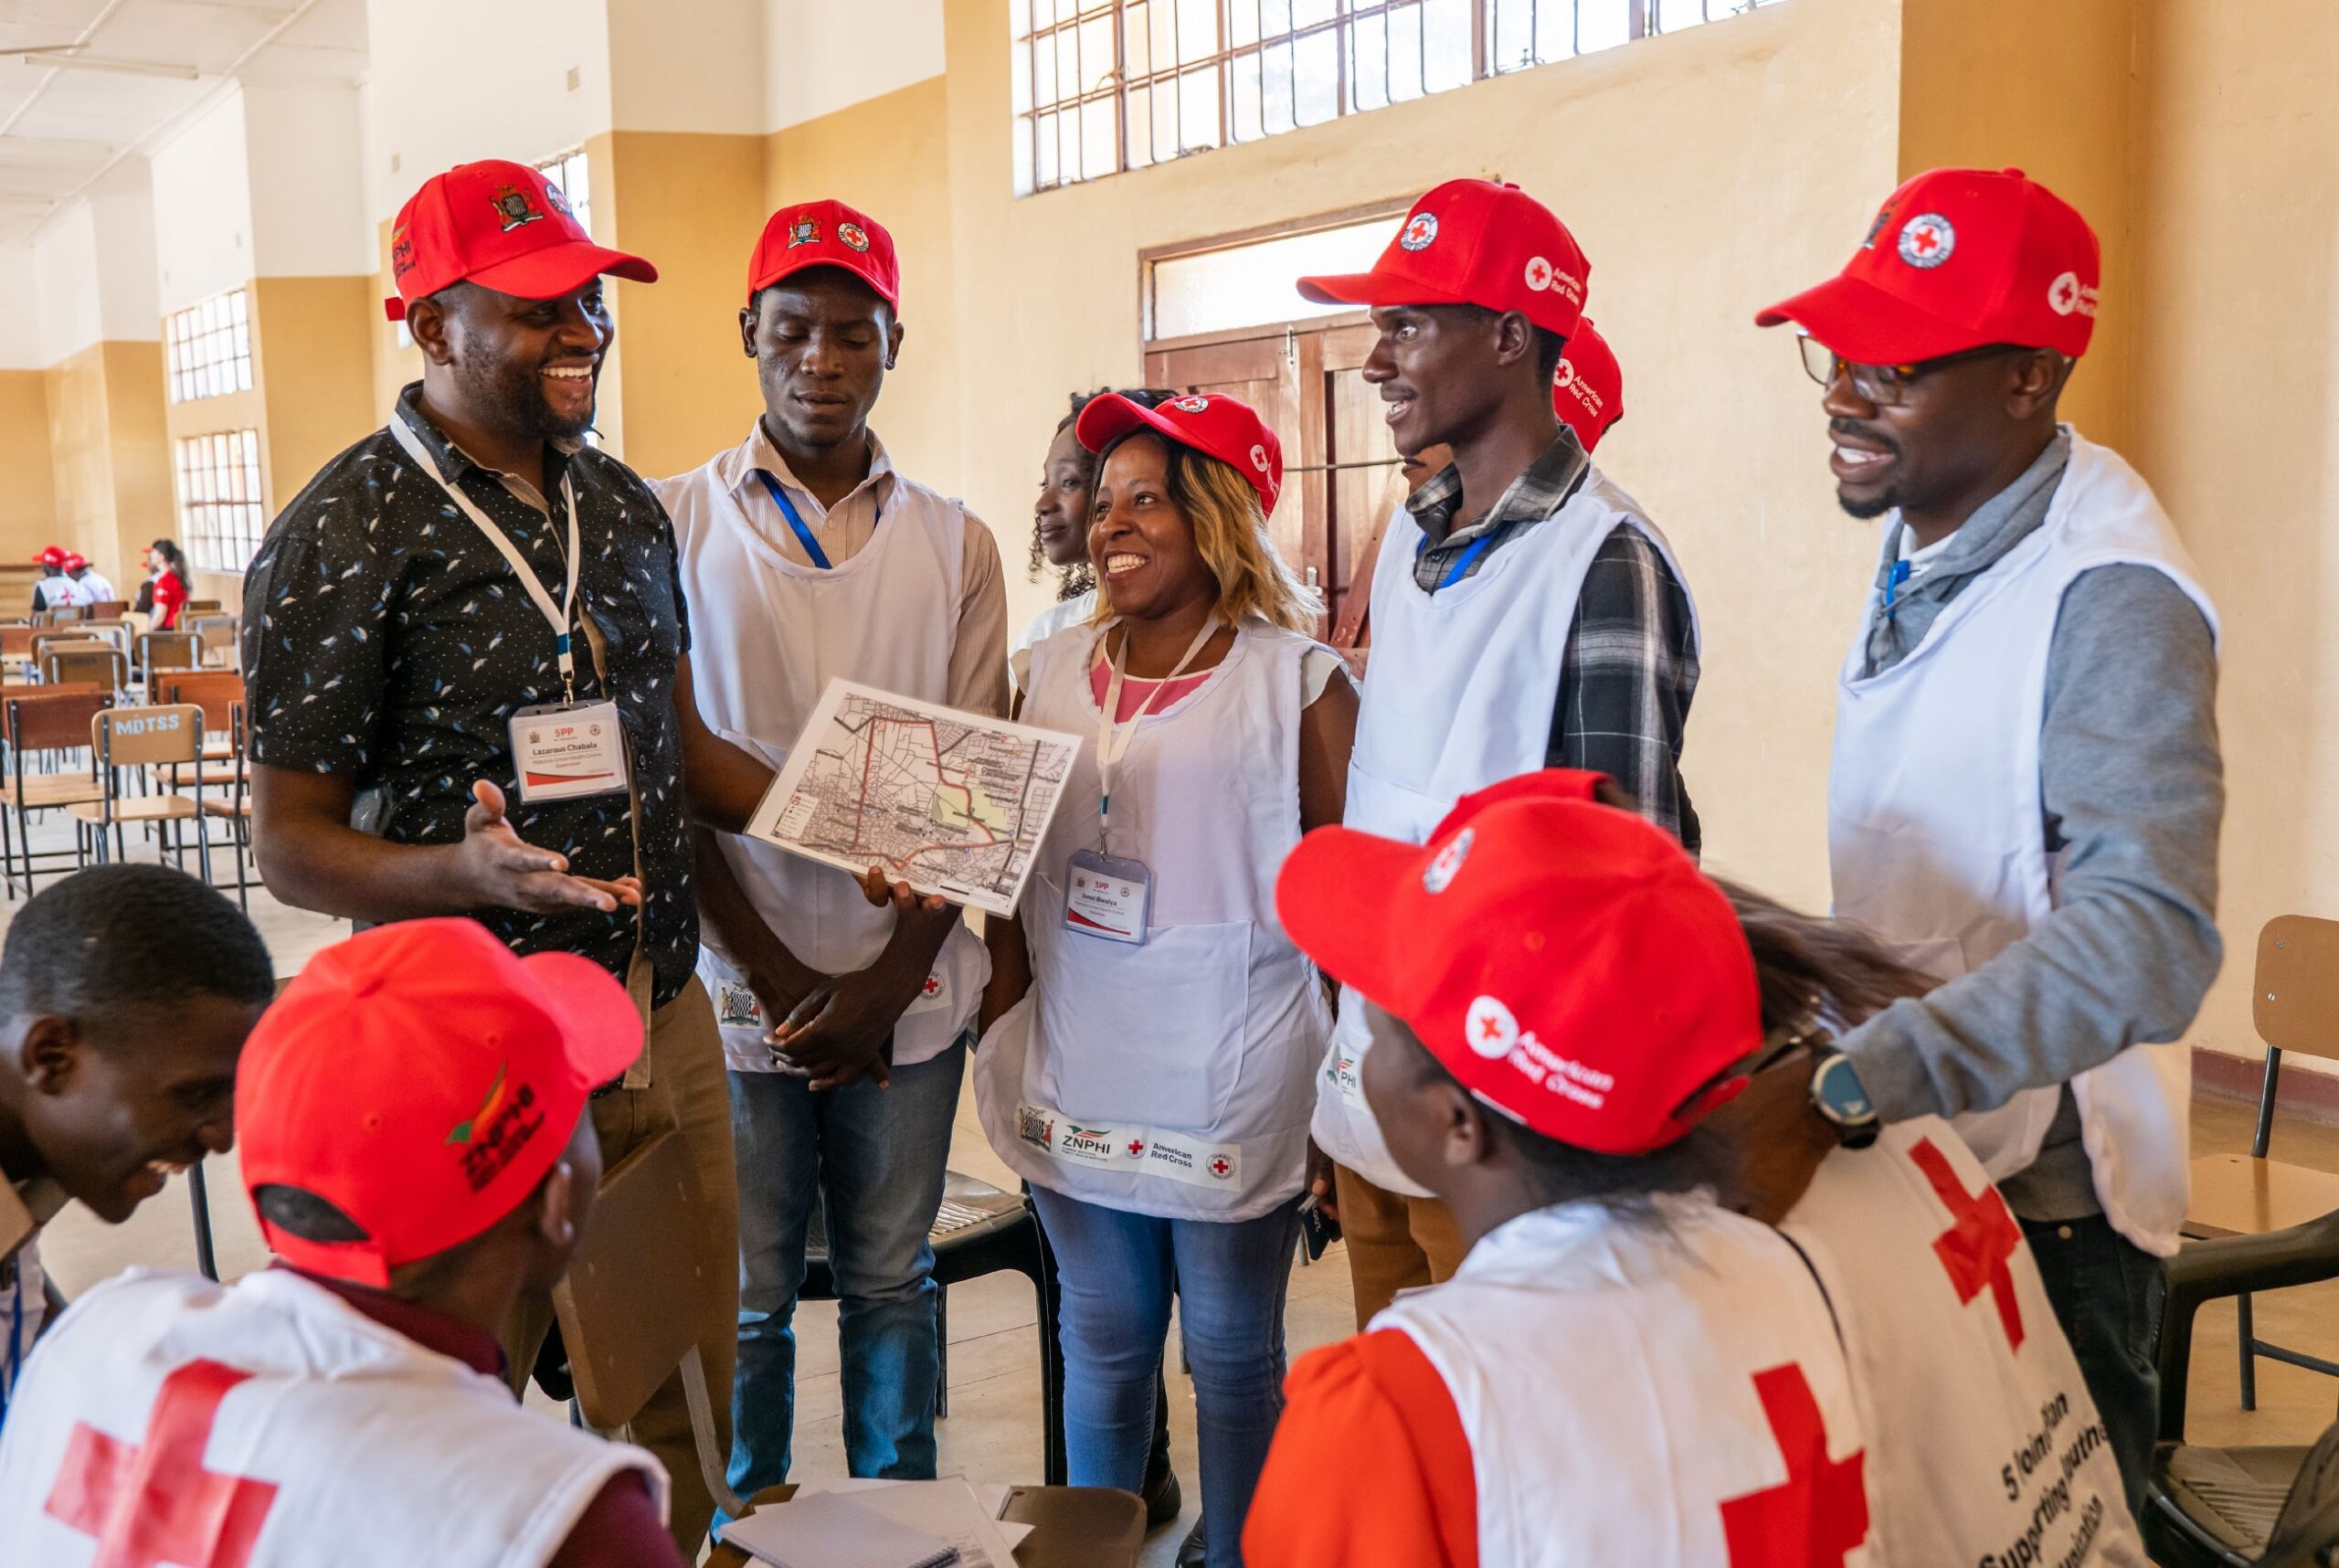
The 2010 Haiti earthquake response exemplified the power of crowdsourcing in crisis mapping. Since then, the integration of crowdsourced data with traditional sources has become increasingly sophisticated, as seen in the response to Typhoon Haiyan. Crowdsourcing empowers non-experts and volunteers to contribute as "digital humanitarians" and "crisis mappers," working alongside established entities like space agencies and satellite providers.
Digitalizing Paper-Based Community mapping in the EVCA
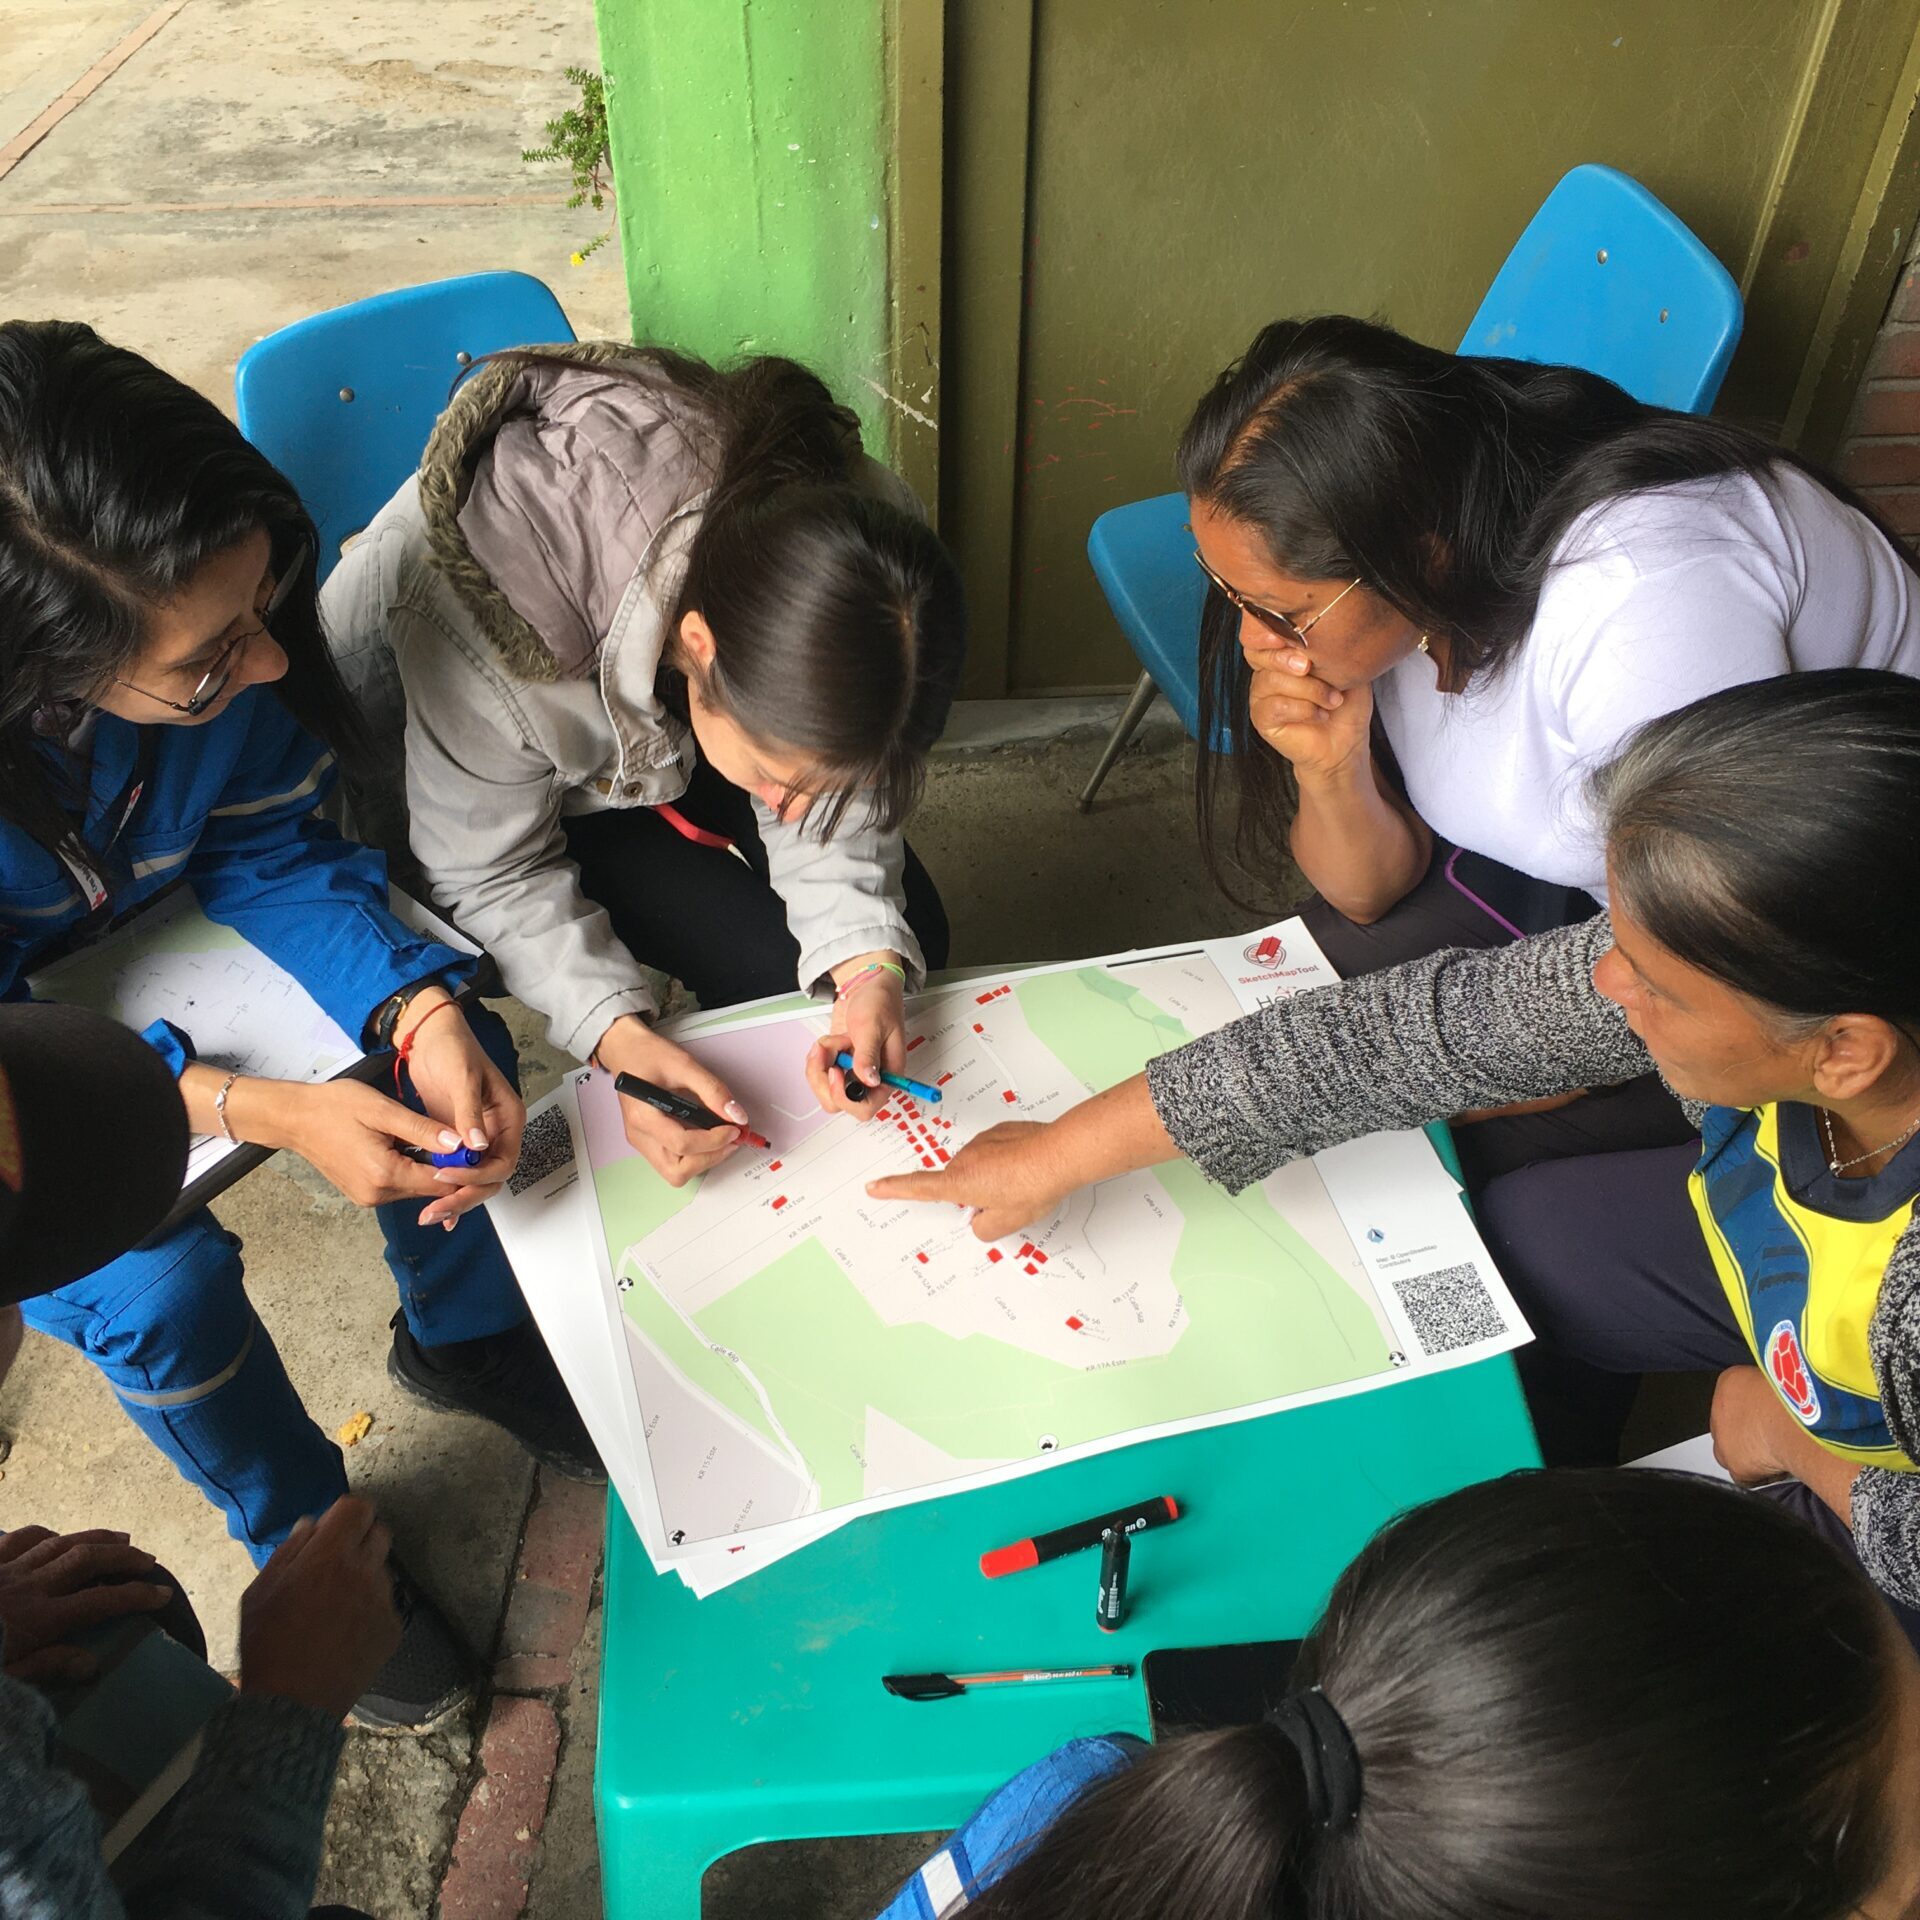
The Sketch Map Tool simplifies participatory mapping, by facilitating the creation and digitalization of paper-based maps that can be used for Vulnerability and Capacity Assessments (VCA)
Humanitarian Mapping Initiatives
The accessibility of free and open tools, such as OpenStreetMap, have inspired the creation of several crowdsourced mapping initiatives that aim to benefit humanitarian and development efforts. One notable example is the Humanitarian OpenStreetMap Team (HOT), an international community dedicated to humanitarian action and community development through open mapping. HOT mobilizes volunteers to create and update free maps for areas affected by crises, natural disasters, or lacking geographic data. These maps serve as critical resources for humanitarians responding to emergencies, enabling them to effectively plan and execute disaster response efforts.
Another example of crowdsourcing in mapping is the Missing Maps project, a collaborative initiative founded in 2014 by Médecins Sans Frontières/Doctors Without Borders, the British Red Cross, the American Red Cross, and HOT. The project aims to place vulnerable populations – both literally and figuratively – on the map by utilizing OpenStreetMap (OSM). Through the Missing Maps project, volunteers help preemptively map populations at risk in vulnerable communities around the world. By addressing these "missing maps" proactively before the next disaster strikes, the project equips emergency responders with detailed geographic information crucial for risk reduction and preparedness activities.
Geospatial data and GIS in disaster risk management
Geospatial data is a broad term that refers to information about real-world locations related to geography, such as topography, census data, and location and map data. Geographic Information Systems (GIS) are a type of geospatial technology that captures, stores, analyzes, manages, and presents various types of geographic data. GIS connects location data with descriptive information detailing the characteristics of those locations, facilitating the understanding of spatial patterns and relationships.
GIS uses multilayered maps to display spatial information such as elevation, meteorological data, resources, man-made structures, mass migration, and demographic data. By using GIS, individuals and organizations can compare different types of location-based information, such as population demographics, environmental characteristics, infrastructure, and land use, discovering valuable insights into spatial relationships.
The use of geospatial data has great potential across all stages of disaster management, including disaster preparedness and risk management. By providing important location-based and geographic information, GIS supports decision-making and more risk-informed and data-driven preparedness and risk reduction strategies.
Risk Assessment and Vulnerability Analysis
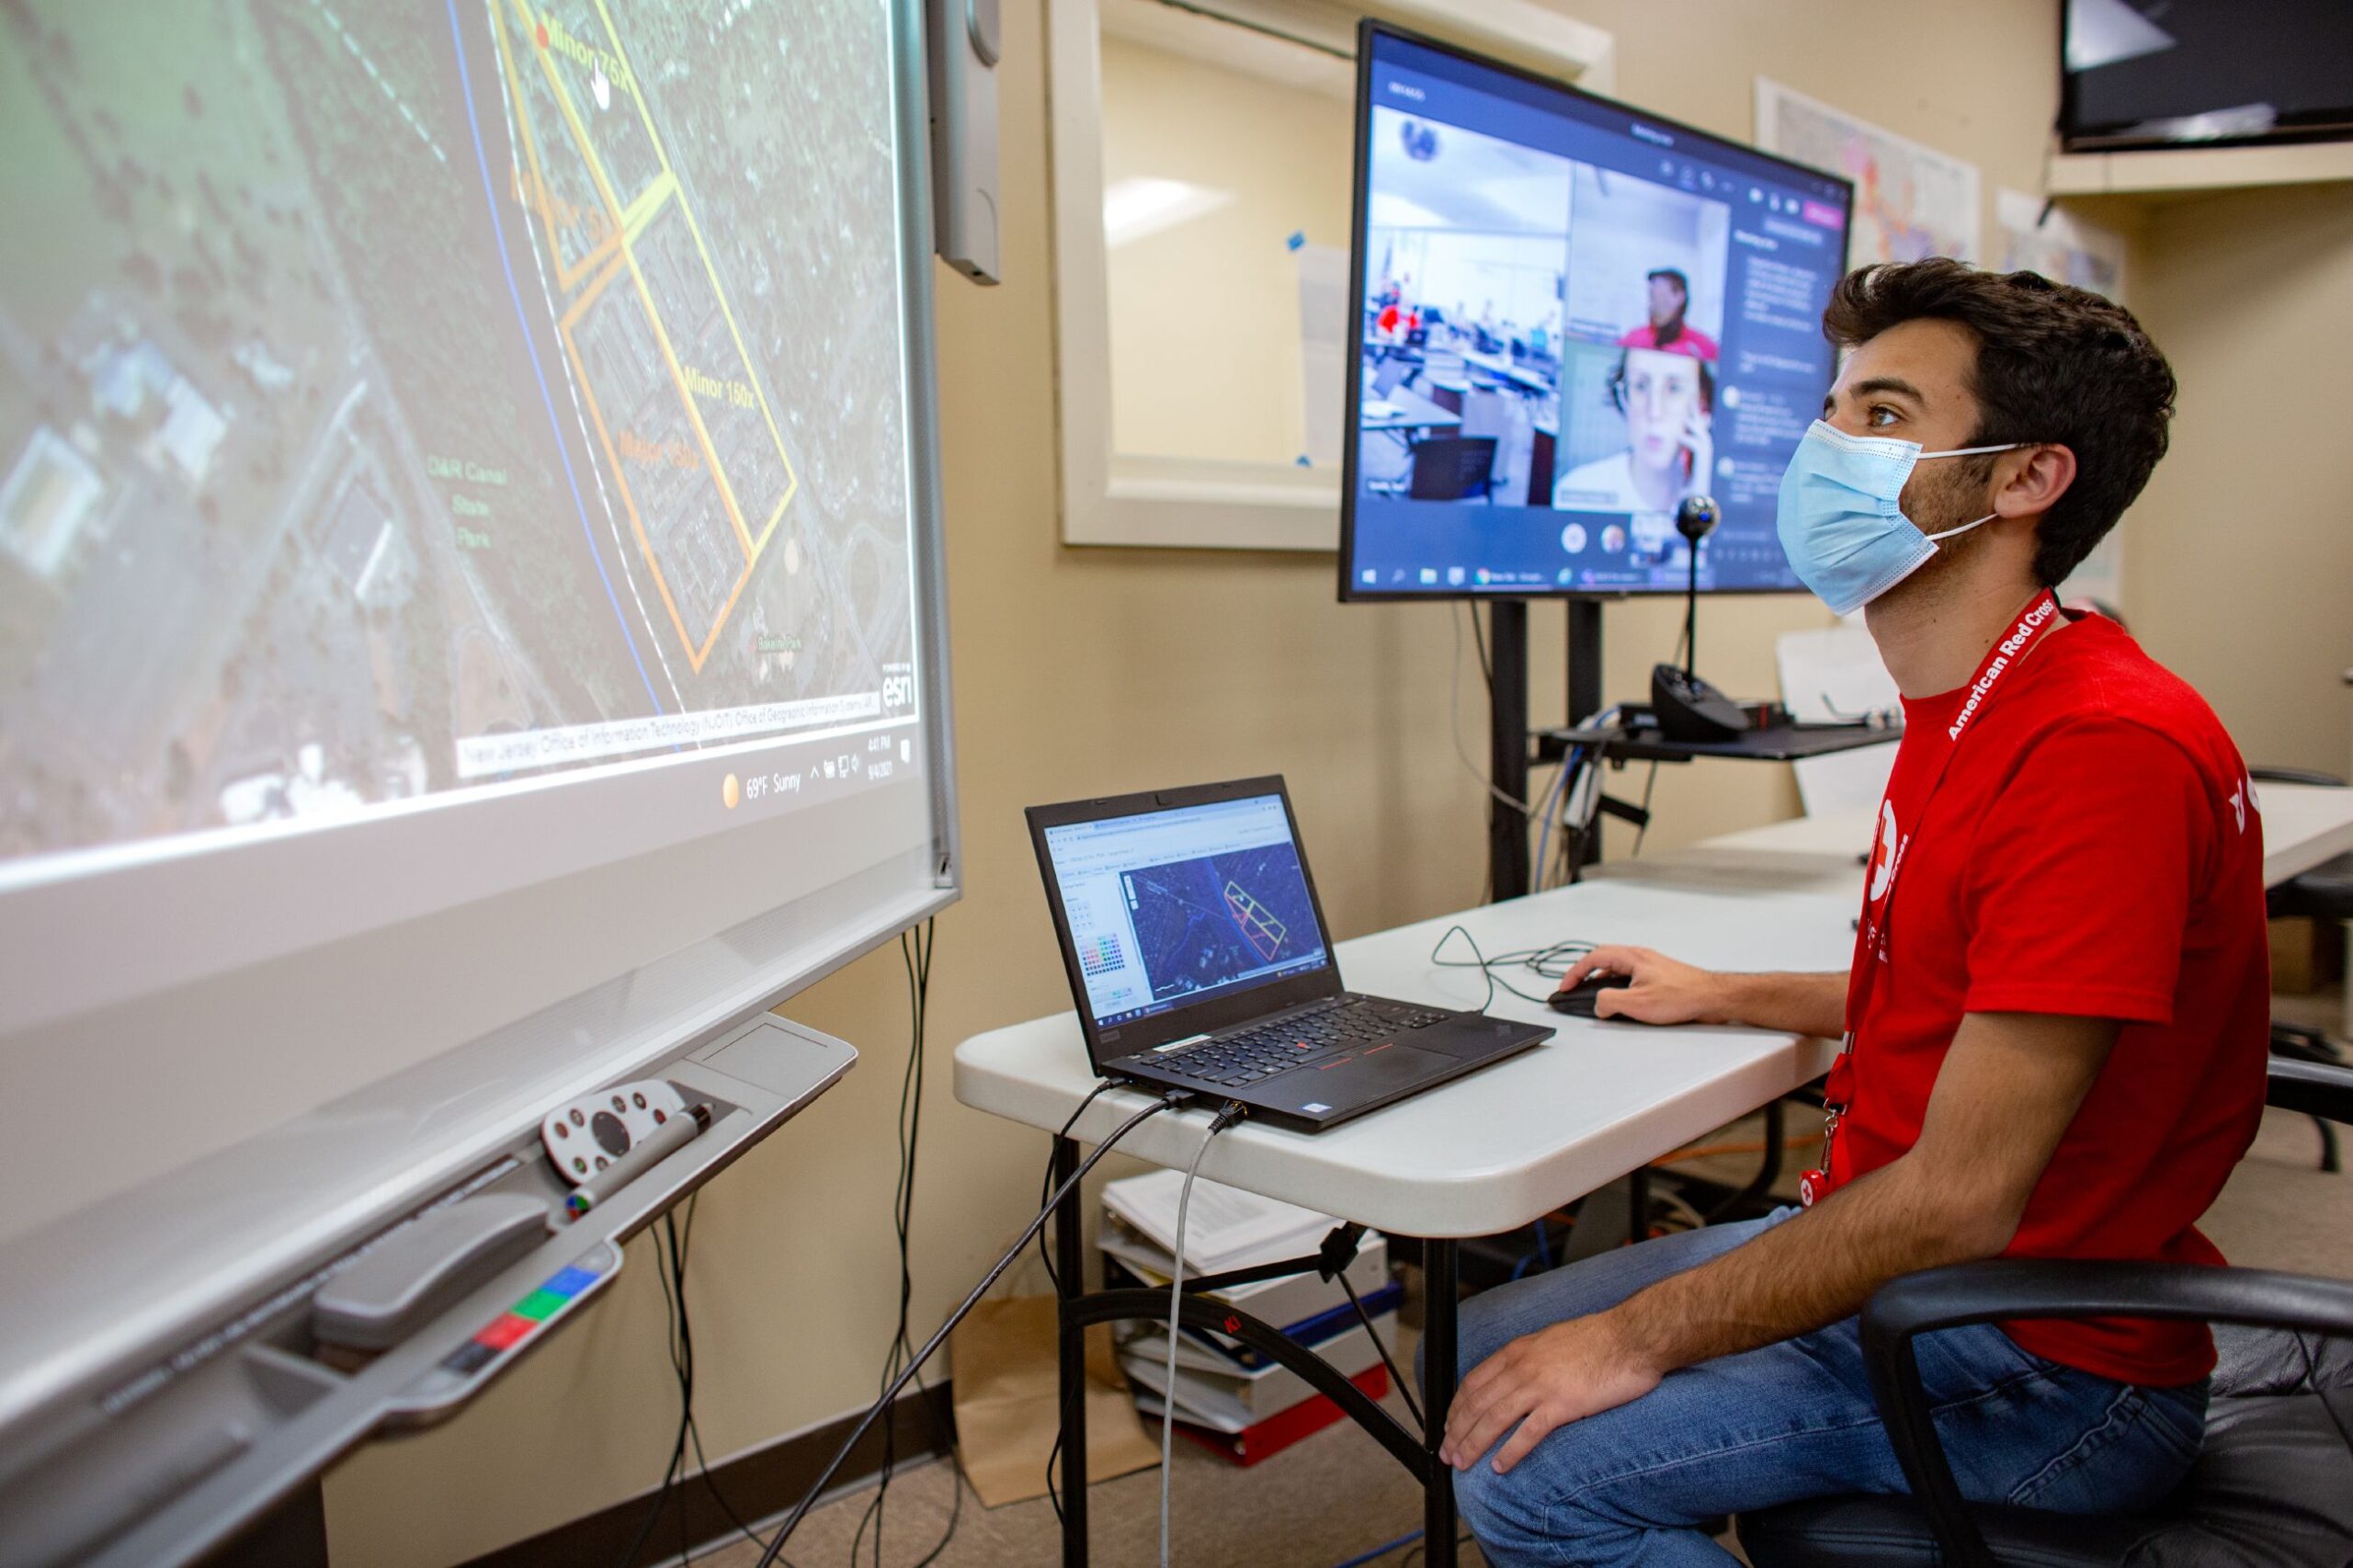
GIS enables comprehensive risk assessments by integrating and analyzing various geospatial data sources, such as historical disaster data, topography, population density, infrastructure, and environmental factors. This allows to locate high-risk and disaster-prone areas for disaster preparedness and mitigation efforts. Through risk analysis, GIS helps identify communities that are particularly vulnerable to various natural hazards due to their geographic location, socioeconomic status, or other factors.
Hazard Monitoring and Forecasting
Remote sensing technologies, combined with GIS, contribute to hazard prediction by analyzing historical data patterns and monitoring environmental conditions. This enables the forecasting of potential disasters, such as tracking hurricane paths or predicting flood-prone areas based on rainfall and topography data.
GIS technology also provides real-time monitoring capabilities, which are crucial during a disaster for tracking and responding to rapidly evolving situations. For example, in the case of a wildfire, GIS can process data from remote sensors and satellites to continuously track the fire's movement, predict its trajectory, and assess damage, allowing for quick decision-making regarding resource deployment and timely warnings to affected communities.
Disaster Preparedness Planning
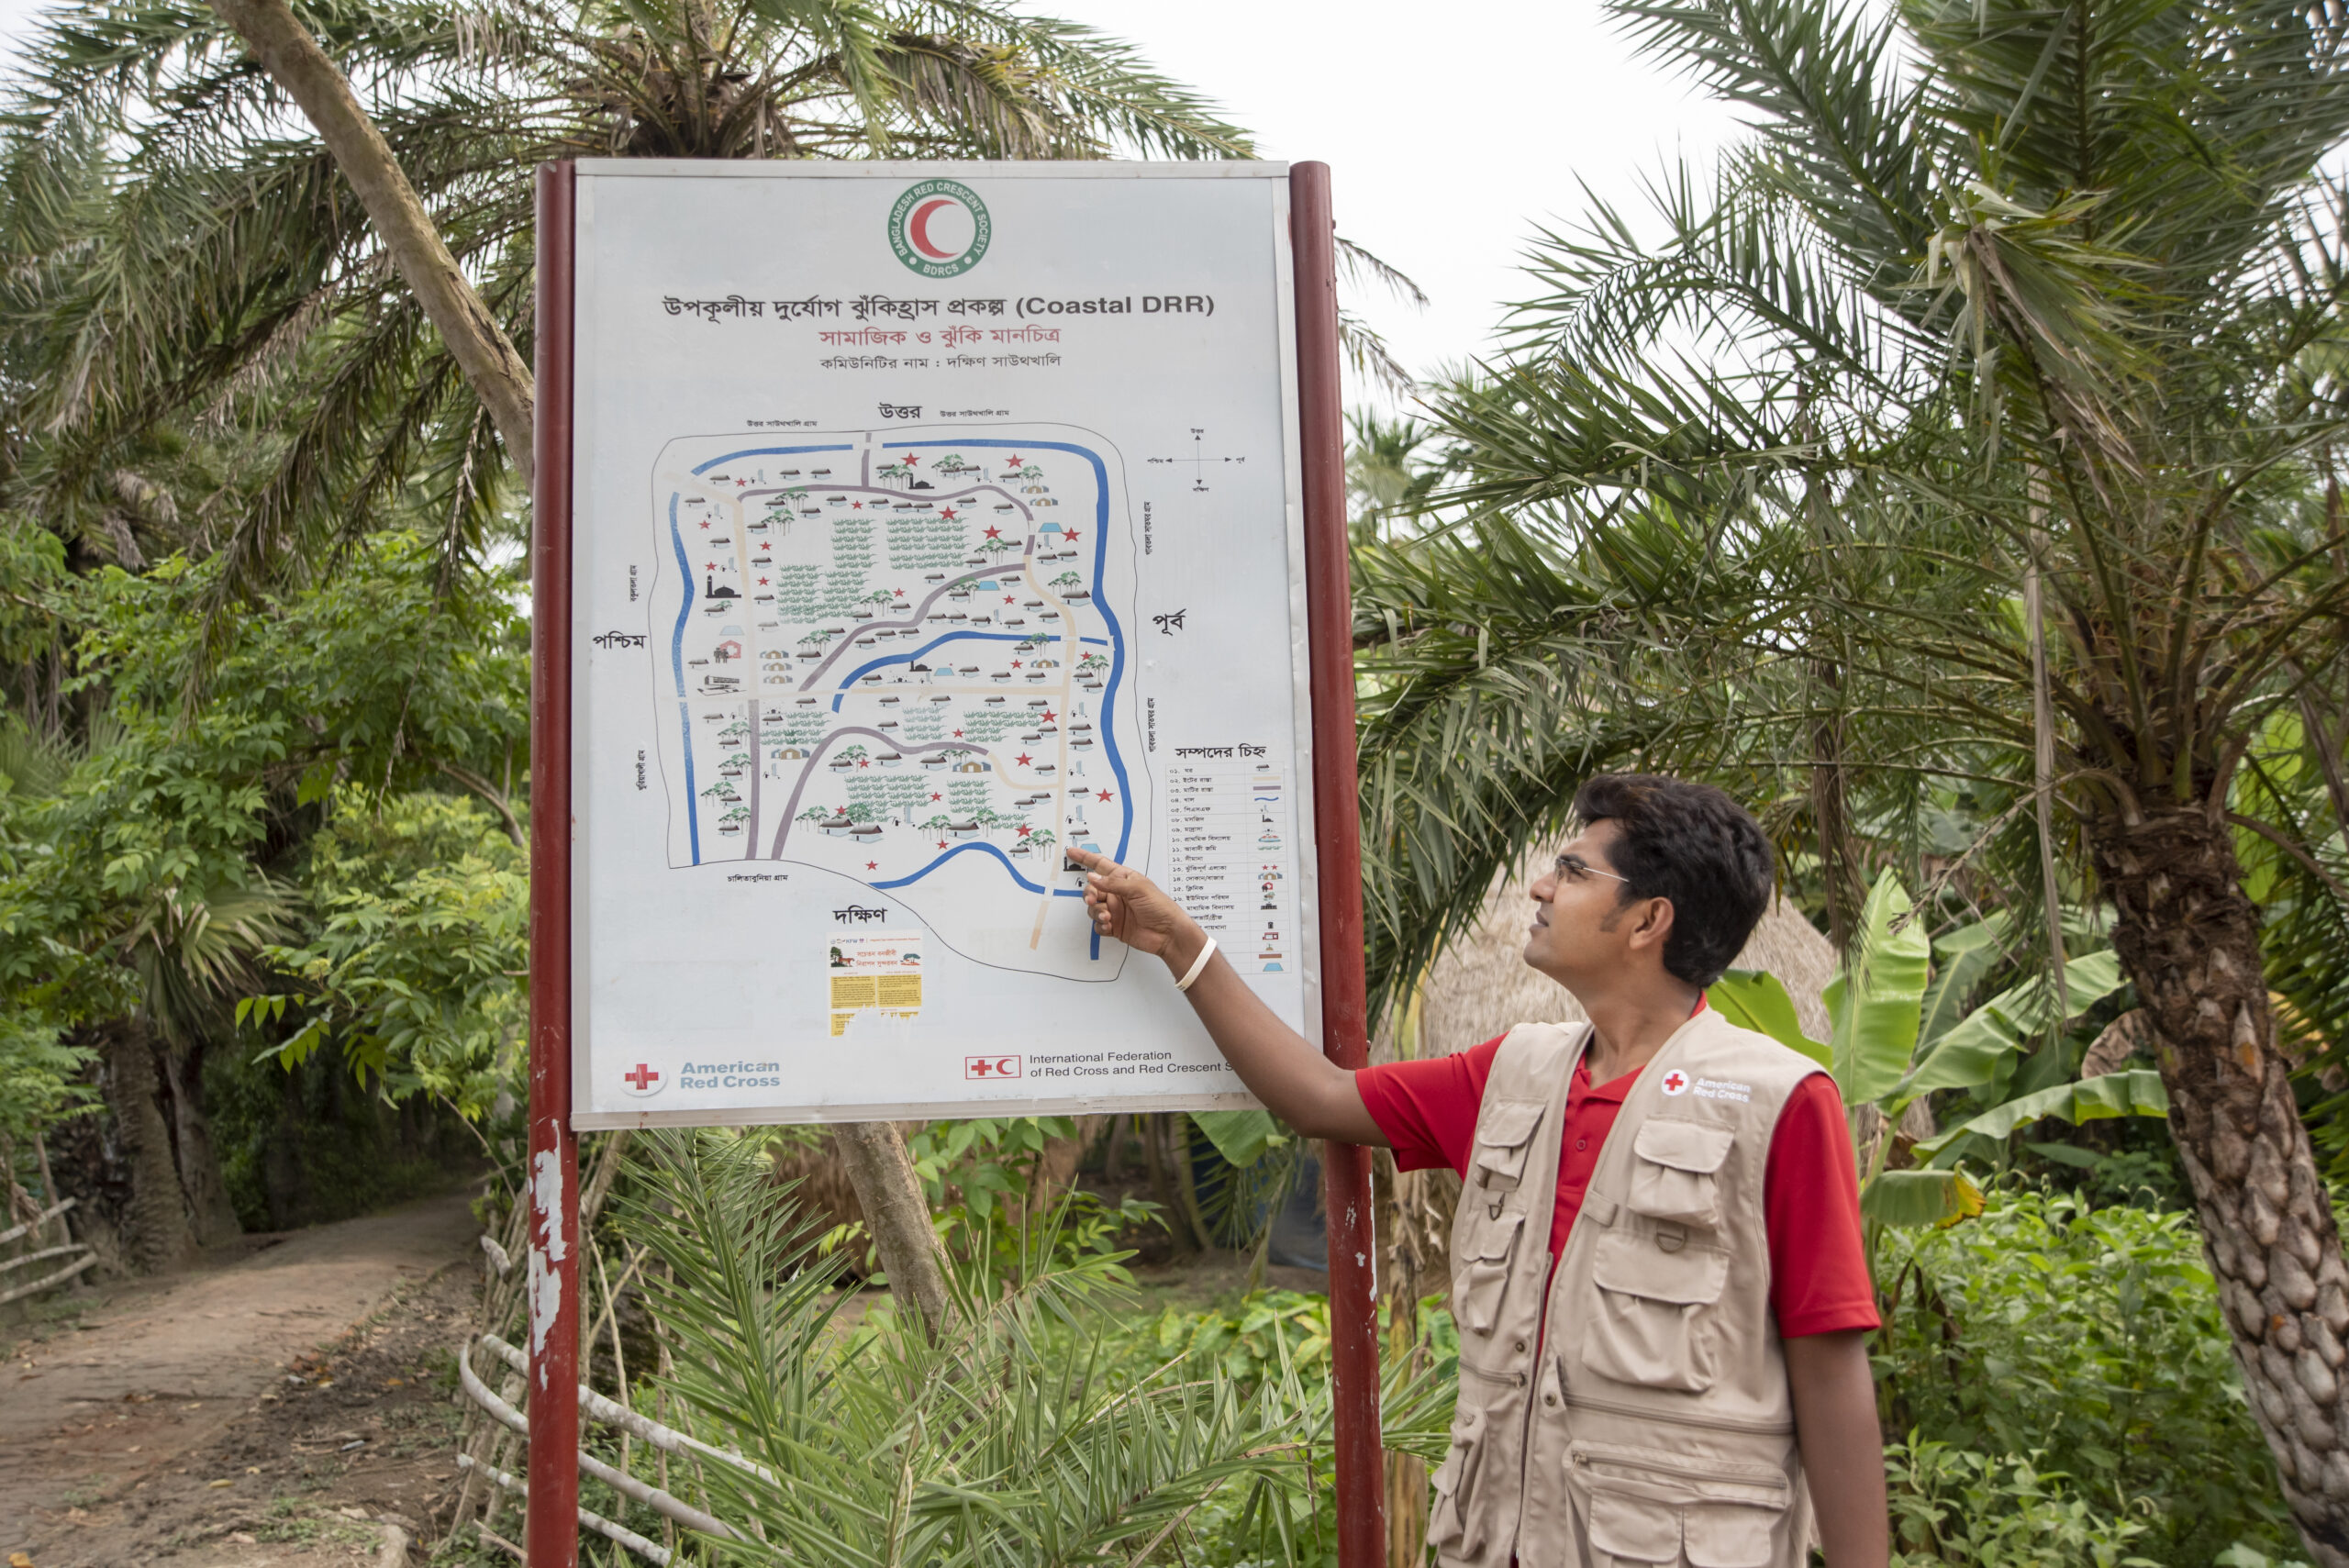
GIS plays a significant role in developing data-informed disaster preparedness plans by providing critical insights regarding available resources and their allocation. Key areas where GIS contributes to disaster preparedness planning include:
- Evacuation Planning: GIS analyzes transportation networks, population distribution, and hazard zones to optimize evacuation strategies and minimize potential bottlenecks or congestion during emergencies.
- Resource Allocation and Logistics: GIS maps the locations of critical facilities (hospitals, fire stations, etc.), transportation networks, and potential staging areas, helping in the pre-positioning of emergency supplies, equipment, and personnel for efficient mobilization during disasters.
- Scenario Modeling and Contingency Planning: GIS enables "what-if" scenario modeling and simulations, allowing emergency planners to test various disaster scenarios and develop contingency plans accordingly.
Informing Risk Reduction Strategies
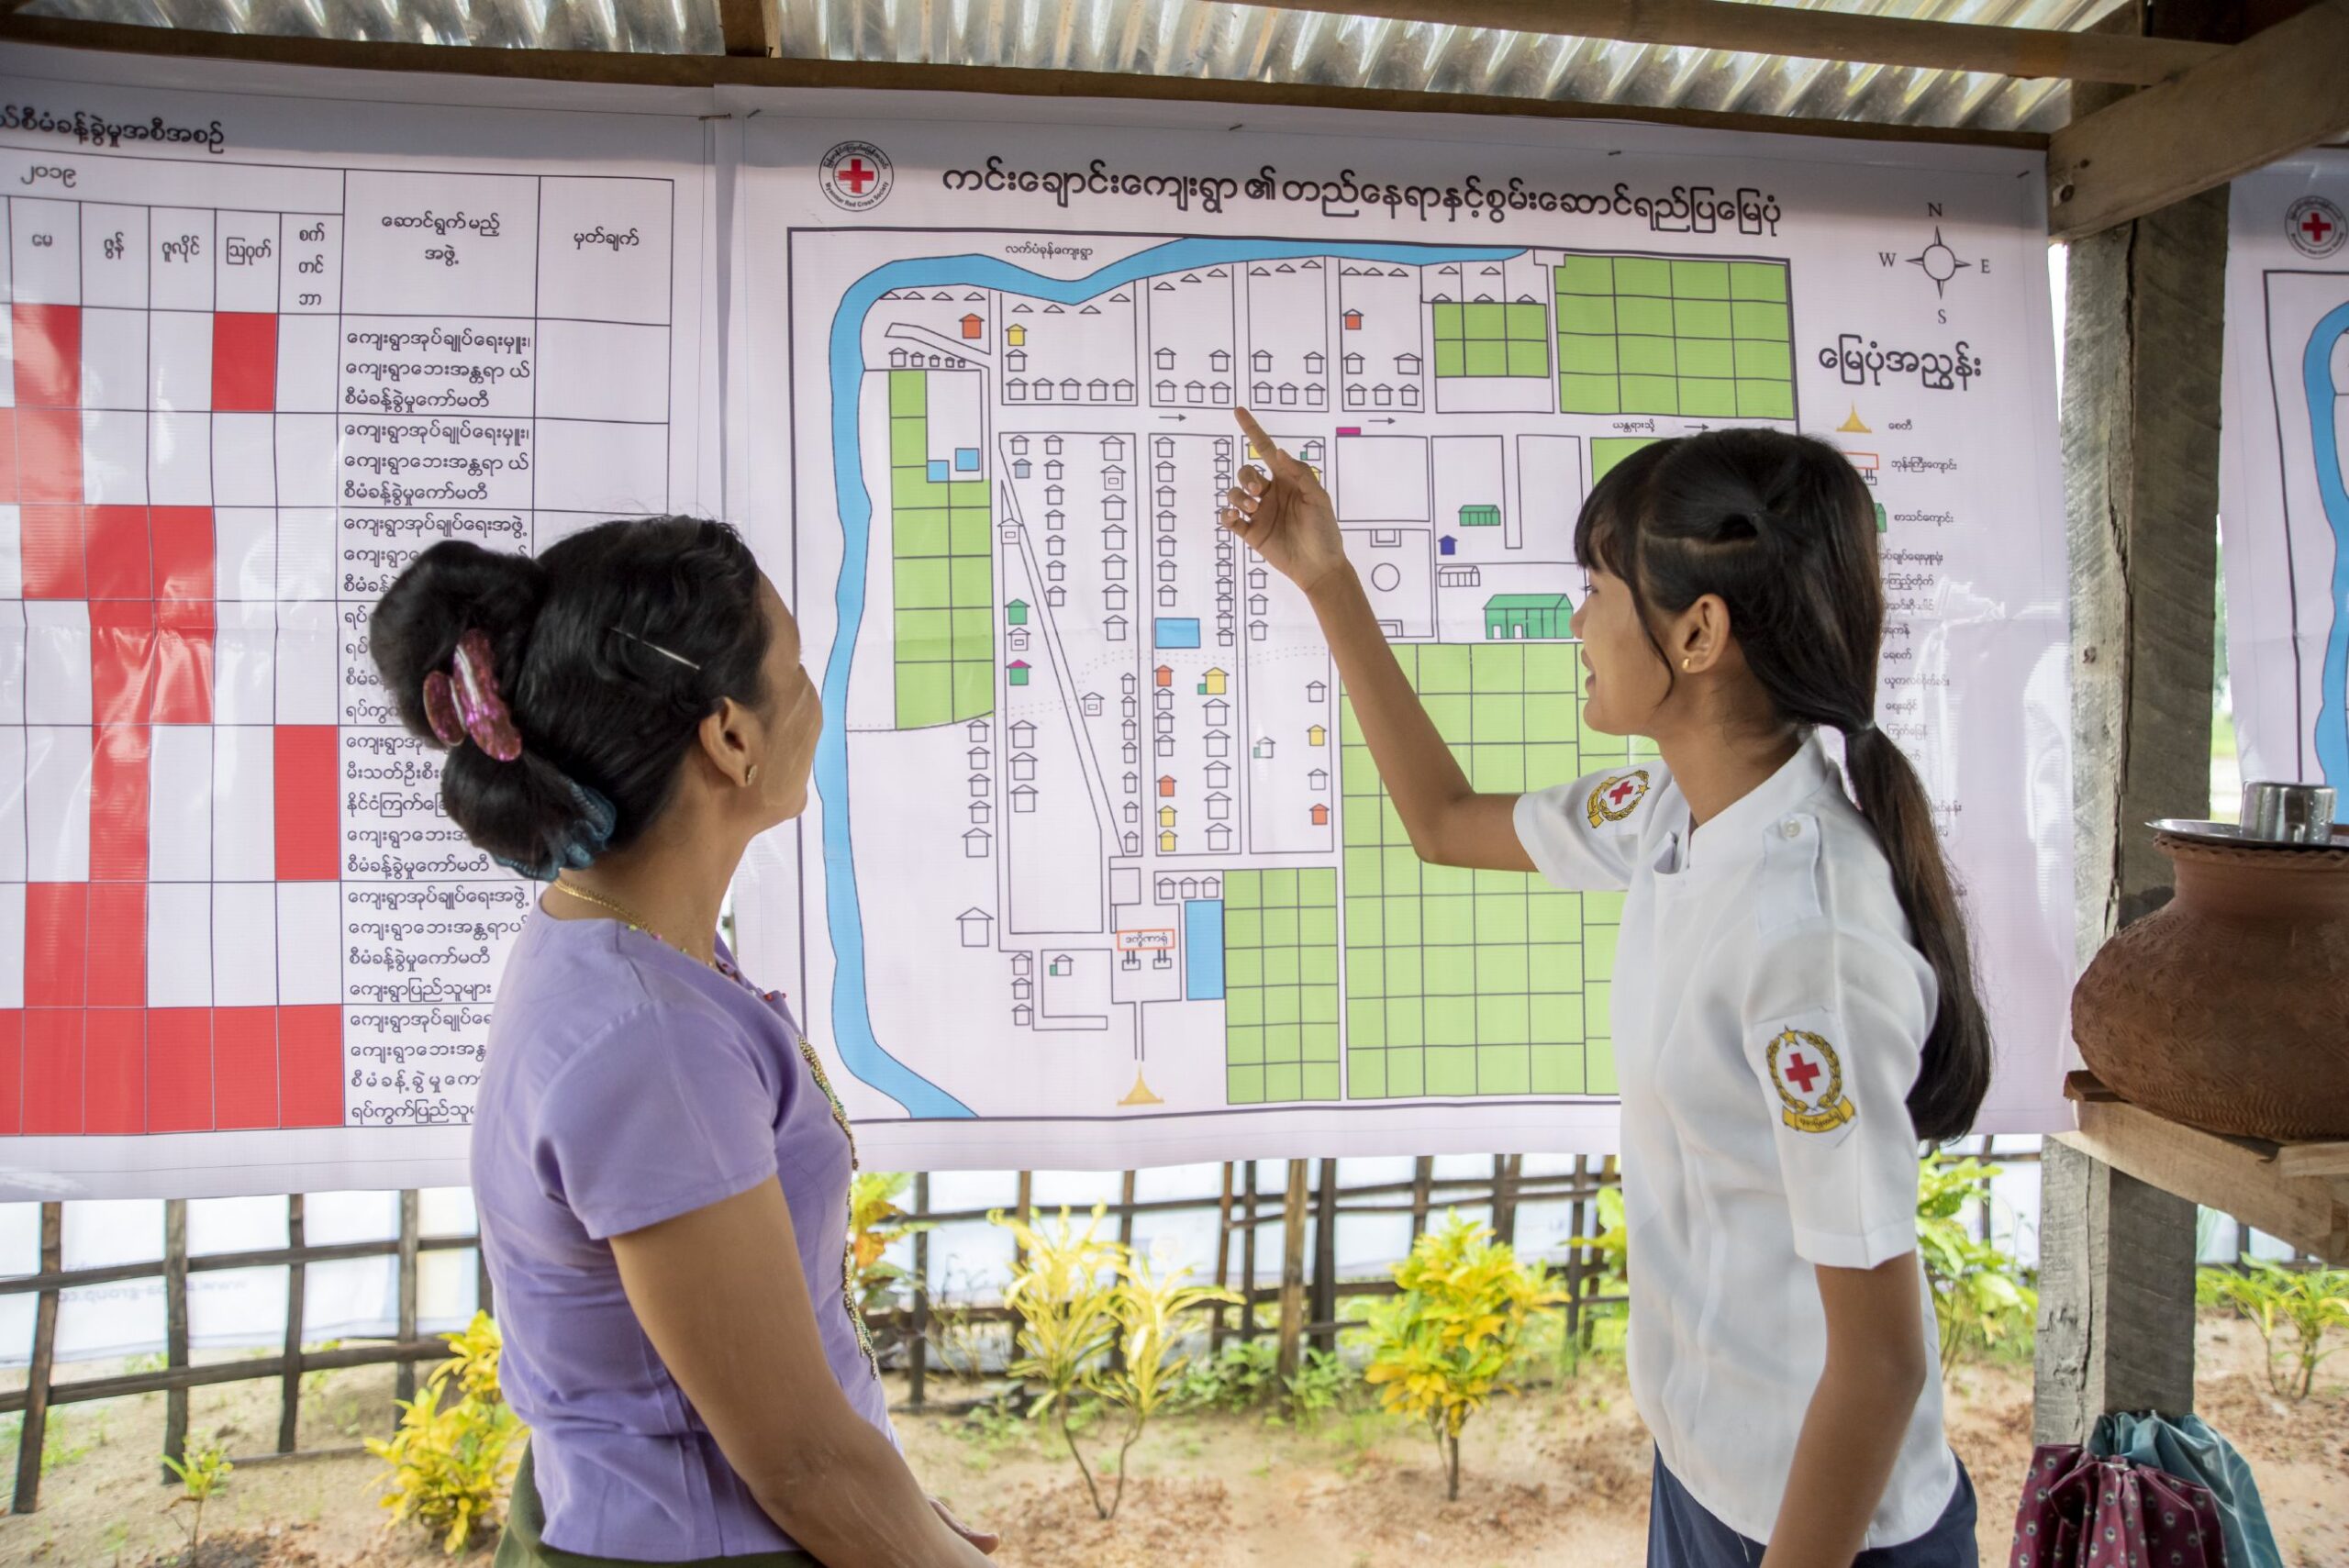
GIS facilitates spatial analysis that authorities can use to implement risk reduction measures. This information can support risk-informed land use planning and zoning decisions, such as restricting development in hazard-prone areas, establishing buffer zones, or implementing building codes and construction standards to mitigate potential impacts.

